Rewind: Your Location Story Through Time
The Rewind page offers a captivating journey through your past location data, transforming it into insightful summaries and visualizations. Discover patterns, revisit significant places, and understand your activity trends over different periods.
Accessing Rewind
You can access the Rewind page from the main navigation menu.
Exploring Your Data
The Rewind page allows you to view your location data summaries on a monthly or yearly basis.
Period Selection
At the top of the page, you'll find a selector to choose the period you wish to explore:
- View Mode: Toggle between
MonthlyandYearlyviews to get a granular or broader overview of your data. - Year Selector: Choose any year for which you have tracking data.
- Month Selector: (Available in
Monthlyview only) Select a specific month within the chosen year.
Changing the period will automatically update the displayed insights.
Digest Sections
Once a period is selected and data is loaded, the page presents various sections:
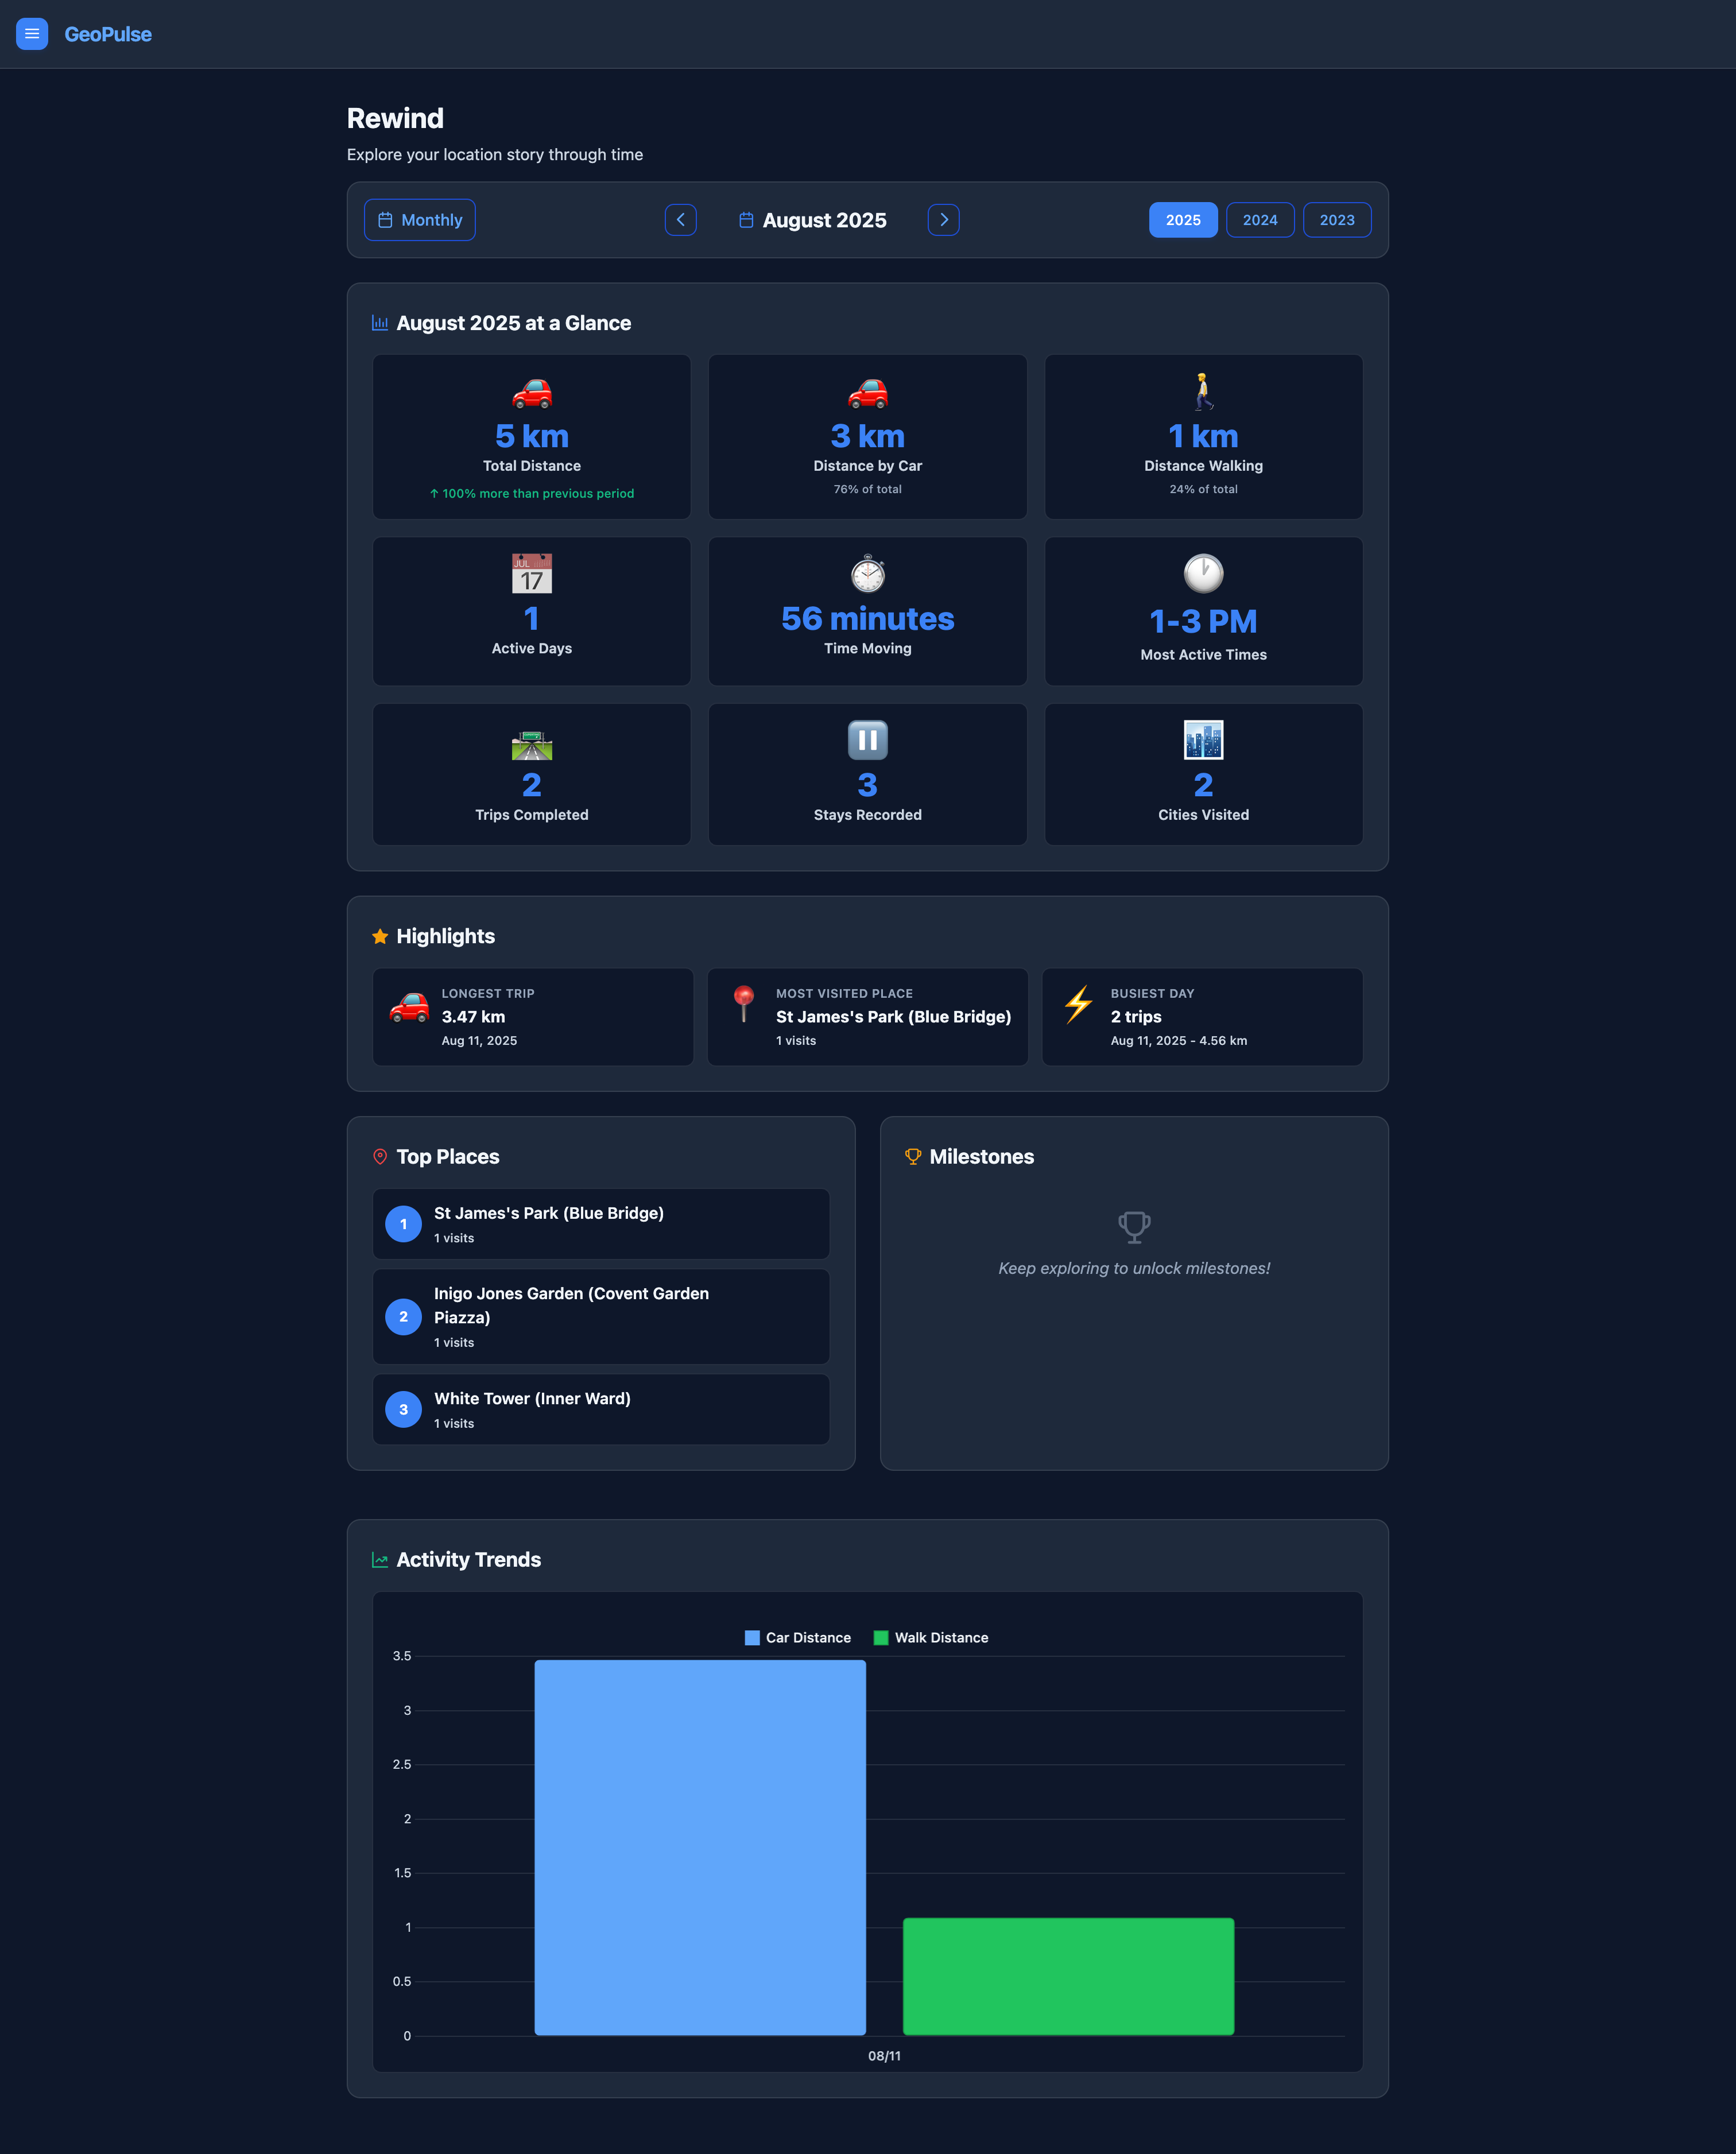
1. Metrics at a Glance
This section provides a quick summary of your activity for the selected period, including key statistics and comparisons to previous periods. You'll see:
- Key Metrics: Important numbers related to your travel, such as total distance, active days, etc.
- Comparison: How your current period's activity compares to the previous one (e.g., "X% more distance than last month/year").
- Highlights: Short, interesting facts or achievements from the period.
2. Highlights
A dedicated section to showcase notable events or interesting facts derived from your location data during the selected time.
3. Top Places
Discover the places you've visited most frequently during the chosen period. This section lists your top locations, helping you identify your most common destinations.
4. Milestones
This section displays any significant milestones or achievements you've reached within the selected period. These could be related to travel distances, consecutive tracking days, or other notable activities.
5. Activity Trends
Visualize your activity patterns over time with interactive charts. This section helps you understand when you are most active, showing trends across days, weeks, or months depending on your selected view mode.